Latency and cost
The two numbers that describe speed, how a request's price is built, and the levers that move each. Measure at your real prompt lengths before optimising.
Two numbers for speed
LLM inference has two phases. Prefill processes the whole prompt in parallel and produces the first token. Decode then generates each later token one step at a time1. Prefill is typically limited by compute and decode by memory bandwidth, which is why speed is reported as time to first token plus a per-token rate1.
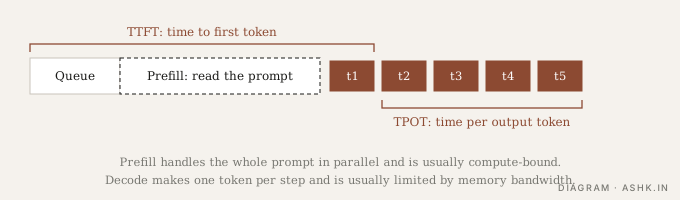
Diagram: my own.
- TTFT, time to first token: queueing plus prefill. It grows with prompt length and with load.
- TPOT or inter-token latency: the gap between output tokens. It sets how fast text streams.
- Total latency is roughly TTFT plus output length times TPOT (my arithmetic, ignoring tool calls).
Practitioner guides also track throughput, percentile latencies such as p95 and p99, and goodput, meaning throughput that still meets your latency target2. Use percentiles, not averages: users feel the slow tail.
Together AI’s advice is to measure both numbers at your real prompt lengths and concurrency, since every optimisation trades latency against throughput and cost1. A benchmark at short prompts and low load will mislead you for an agent that sends long contexts.
How a request is priced
For API use, the bill per call is input tokens times the input price plus output tokens times the output price. Output tokens are usually priced higher than input tokens (check your provider’s table). Cached input and batch requests have their own rates (Prompt caching).
Agents change the shape of the bill. Each turn re-sends the growing conversation, so input tokens usually dominate and grow with the length of the run (The execution loop). Long tool outputs get paid for again on every later turn, which is the cost side of context as a budget.
For self-hosted models, cost per token falls as the GPU is kept busy. The vLLM authors motivate their work by noting that a request can cost many times more than a traditional keyword query, citing press reporting, which makes throughput per GPU the lever that matters5.
Levers
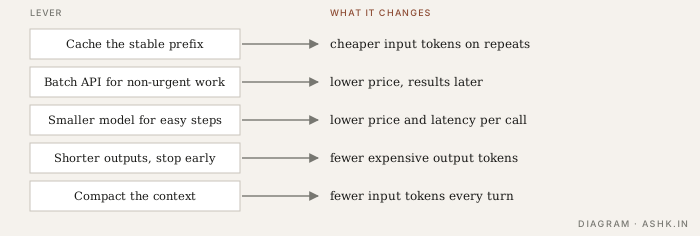
Diagram: my own.
- Cache the stable prefix. Anthropic’s docs describe cache reads at a fraction of the normal input price3.
- Batch non-urgent work. Anthropic’s batch API processes requests asynchronously at half price, with results available within 24 hours4.
- Route by difficulty. Use a smaller, faster model for easy steps and a larger one for hard steps (Workflows vs agents).
- Shorten outputs. Ask for concise formats, set sensible maximum output limits and stop early.
- Compact context. Summarise or drop stale tool output (Compaction and summarisation).
- Stream. Streaming does not reduce total time, but it improves perceived latency because the first tokens arrive sooner.
- Run independent calls in parallel, where results do not depend on each other (Choosing a pattern).
Know which bottleneck you have
- Long wait before anything appears: prefill or queueing. Shorten the prompt, cache the prefix, reduce load.
- Slow streaming after a quick start: decode. Smaller model, quantisation, speculative decoding, or fewer output tokens.
- High cost but acceptable speed: look at input volume and cache hit rate.
- Good averages but bad tails: look at batching and load (Batching).
Log these per request, with token counts, cache hits and tool time, so that you can see which one you have (Tracing and monitoring).
Sources
- [1]What is LLM inference — Together AIPARAPHRASED
- [2]How LLM Inference Works, a practical guide to serving and optimizing large language models — DataCamp · 2026LIST OF METRICS, AS SUMMARISED BY A THIRD PARTY
- [3]Prompt caching — Anthropic docsPARAPHRASED
- [4]Batch processing — Anthropic docsPARAPHRASED
- [5]Efficient Memory Management for Large Language Model Serving with PagedAttention — Kwon et al. · 2023PARAPHRASED